

The Energy Transition
EV Impact
The transportation sector remains the largest source of greenhouse gas emissions in the U.S., consuming nearly 70% of crude oil. Gasoline vehicles operate at only 30% efficiency with 70% going to pollution, while electric vehicles operate at an average of 90% energy efficiency with zero carbon exhaust.
Since the introduction of gasoline-powered vehicles in the 19th century, the U.S. population has grown by approximately 268 million, with nearly 300 million cars now on the road. Decarbonizing the U.S. is urgent.
*Source: https://www.edf.org, https://www.energy.gov, https://www.altenergymag.com, https://www.iea.org
-
In the next five years, EVs on U.S. roads are expected to grow by 30 million, a 900% increase.
-
A major supply gap is projected as the global EV market expands from $725 billion in 2024 to $1.5 trillion by 2030.
-
EV manufacturing is projected to create an estimated 931,100 U.S. jobs by 2028.
-
The mass adoption of EVs reduces dependence on imported petroleum and fosters domestic energy independence.
-
As of 2022, EVs have enabled a net reduction of about 80 million tonnes of greenhouse gas emissions.
Our Preorder Demand: 80,000+
Alpha Motor recently surpassed 80,000 vehicle preorder indications as of November 4, 2024.
Key Highlights:
Strong Demand: High purchase intent confirms market potential and competitiveness.
Organic Growth: Preorders secured with $0 ad spend, demonstrating genuine demand and brand awareness.
Competitive Advantage: Allows consumers to express interest freely, providing valuable market insights.
*80,043 vehicle preorder indications received as of Nov 4, 2024; preorders are indications of intent to buy and require no deposit; $0 in ad expenses attributed to preorders
-
Our automotive expertise and passion drive our commitment to advancing transportation. Below are the key reasons why trucks are set to lead the energy transition in the industry.
Largest Addressable Market – Trucks are the best-selling category in the U.S., representing a significant portion of the market.
Better Business Opportunity – Trucks have strong unit economics, enabling greater capital efficiency.
Strong Consumer Demand – Trucks have high usage rates, creating a strong entry point for EV adoption.
Scalability – Trucks scale efficiently with our modular technology, supporting a diverse lineup of SUVs and crossovers.
Tax Incentives – Federal and state programs offer tax credits and rebates for buying electric trucks.
Emissions Impact – Gas-powered trucks burn more fuel, so switching to electric reduces emissions significantly.
EV Performance – EV technology enhances truck capabilities, delivering greater performance and value to consumers.
Growing Market – Electric trucks are set for major growth, with sales expected to rise over 34% annually by 2030.
-
Alpha Motor has exhibited at:
Petersen Automotive Museum (2021–2022)
SEMA Show (2023)
Seoul Mobility Show (2023)
-
Everyone is welcome to Alpha Motor! Currently, 72.4% of our audience is between the ages of 25-54, with most residing in California, Florida, and Texas. In the U.S., trucks account for approximately 61% of nearly 300 million vehicles.
-
Through the strategic commercialization of electric vehicles, we are replacing gasoline vehicles—responsible for over 3 billion metric tons of CO₂ emissions annually worldwide. With 56% of new vehicle sales projected to be electric by 2030, U.S. consumers are increasingly looking to buy EVs, yet limited options have created a significant supply gap. We accelerate the transition to zero emissions by producing electric trucks—the largest addressable vehicle market in the U.S.—and achieving affordable direct-to-consumer solutions through innovation in manufacturing efficiency.
-
Alpha Motor’s electric vehicles are designed, engineered, and manufactured in the United States.
Our Preorder System
-
Preorders indicate interest to buy and require no deposit.
To place a preorder, visit the Reservation Page.
-
Our preorder system prioritizes consumers and helps us produce EVs people want to buy.
-
Allows consumers to express interest freely, providing valuable market insights.
Validates market demand and aligns production with consumer needs.
Integrates directly with our production technology, accelerating market response.
We cover the development costs required to make diverse options available.
Our preorder system establishes a new standard in market research.
Our Priorities
Consumers First
Producing the best EVs for consumers is our guiding principle, driving operational excellence.
Consumers 〉Trends
(Consumers shape industry trends)
Efficiency 〉Speed
(Efficient processes accelerate innovation)
Scalability 〉Style
(Scalability enables widespread adoption)
Refinement 〉Branding
(Continuous improvement in quality builds trust)
Durability 〉Complexity
(Long-lasting usability delivers tangible value)
Consumer Opinions
Consumers share their thoughts on the Wolf electric truck and whether they see themselves purchasing one in the future.


*Sources (top to bottom): SEMA, Las Vegas, Nevada; TopGear; JRE Podcast; Wolf Truck Drive Event. Unpaid endorsements and testimonials.
EV Stats & FAQs
A. EV Market and Adoption
-
2024: 8.7%
2023: 7.3%
2022: 5.8%
2021: 3.2%
2020: 1.7%
EV adoption increased at an average CAGR of 50.4% between 2020 and 2025, indicating rapid market expansion.
Typical CAGR Benchmarks:
The global stock market (S&P 500) historically grows at ~8-10% CAGR.
High-growth tech companies might see 20-30% CAGR.
Mature industries usually see single-digit CAGR (3-8%).
Other Stats:
California has the highest EV adoption rate at 27%.
One out of three new car sales in the U.S. is projected to be electric by 2027.
The U.S. government projects half of all new car sales to be electric by 2030.
-
Once EVs surpass 5% of total annual vehicle sales, adoption can accelerate to 25% market share within five years.
U.S. EV sales crossed the 5% threshold between 2021 and 2022 and are projected to account for one-third of total car sales by 2027.
-
The U.S. EV market share has increased from 1.7% in 2020 to 8.7% in 2024.
Globally, EV market share has risen from 4.2% in 2020 to 21% in 2024.
-
EVs accounted for 8.7% of total car sales in 2024.
-
Cost: 70% of consumers cite vehicle cost as a barrier to EV adoption.
Charging Infrastructure: 60% of consumers express concerns over insufficient charging infrastructure.
B. Charging Infrastructure
-
As of December 2024, the U.S. has over 207,000 public charging ports and more than 68,000 charging stations.
In comparison, there are a total of 150,000 gas stations in the U.S.
-
For gasoline-powered vehicles, there are 1,966 vehicles to every gas station versus 86 EVs to every charging station.
EVs have a better ratio to charging ports than gasoline-powered vehicles to gas stations.
About 60% of Americans live within 2 miles of a public EV charger.
There are an average of 104 gas pumps per 1,000 miles versus 22 EV charging stations.
There are 14 times more charging stations per EV than available gas pumps per gasoline-powered vehicle in the U.S.
-
California, New York, Florida, Texas, and Washington are the top five states, accounting for 46.4% of all EV charging stations in the U.S.
Los Angeles has the most charging stations of any city in the U.S., with nearly 1,600 stations.
-
83% of EV owners in the U.S. have access to home charging.
56% of charging sessions occur outside the home (public stations, roadside, workplace).
-
Between 2021 and 2024, the number of publicly available EV chargers doubled.
The U.S. charging network is ahead of schedule, with a goal to install 500,000 charging points by 2030.
57.8% of major U.S. highways now have high-speed chargers every 50 miles, meeting federal infrastructure goals.
C. Geographic Trends
-
California: 1,256,646
Florida: 254,878
Texas: 230,125
Washington: 152,101
New York: 131,250
-
States with the highest number of EVs per 100,000 residents, indicating strong EV sales growth, are California, Hawaii, Washington, Oregon, and Colorado.
-
High Temperatures: At 95°F (35°C), an electric vehicle's (EV) range can decrease by approximately 15%.
Cold Temperatures: At 32°F (0°C), EVs can experience a range reduction of about 20%.
-
EV adoption in rural areas is 40% lower than in urban areas across the U.S.
-
Federal Tax Credit offers up to $7,500 for eligible all-electric and plug-in hybrid cars purchased after 2010.
California
Clean Vehicle Rebate Project (CVRP) – Up to $7,500 for eligible EVs.
Burbank Water and Power (BWP) – Up to $1,000 for a pre-owned EV (at least two years old).
Turlock Irrigation District – Up to $4,000 for eligible used EVs ($1,000 standard, $4,000 for income-qualified buyers).
Southern California Edison (SCE) Pre-Owned EV Rebate – Up to $4,000 for eligible used EV purchases or leases.
SCE Charge Ready Home Rebate Program – Up to $4,200 for installing a Level 2 EV charger within 120 days of acquiring an EV.
Colorado
Vehicle Exchange Colorado (VXC) Program – Up to $6,000 for income-qualified individuals purchasing an EV.
Connecticut
Hydrogen and Electric Automobile Purchase Rebate (CHEAPR) Program – Up to $5,000 for the purchase or lease of an EV or hydrogen fuel cell vehicle.
Delaware
Delaware Clean Vehicle Rebate Program – $2,200 rebate for purchasing or leasing an EV and $1,100 rebate for converting a combustion engine vehicle into an EV.
Maine
Efficiency Maine EV Rebate Program – Up to $2,000 for new EVs and $1,000 for plug-in hybrids, with up to $7,500 for income-qualified buyers.
New York
Drive Clean Rebate Program – Up to $2,000 in rebates for eligible EV purchases or leases.
Oregon
Oregon Clean Vehicle Rebate Program – Up to $2,500 for the purchase or lease of new EVs, with additional incentives for low- and moderate-income households.
Pennsylvania
Alternative Fuel Vehicle Rebate Program – Up to $2,000 for the purchase of new EVs and plug-in hybrids.
Texas
Texas Emissions Reduction Plan (TERP) – Up to $2,500 for eligible EV purchases or leases.
Washington
Sales Tax Exemption – Exemption on the first $20,000 of a qualifying new EV’s selling price.
D. Consumer and Market Trends
-
In the U.S., 7 out of 10 best-selling EV models in 2024 were light trucks.
Globally, 55% of new EV registrations in 2023 were light trucks.
Texas and California lead in total light truck sales, accounting for over 20% of the U.S. market.
Wyoming and North Dakota have the highest truck ownership per capita, making up over 41% of vehicle sales.
-
51% of pickup truck buyers would consider an electric or hybrid powertrain for their next purchase.
Nearly 60% are considering electric options due to increasing gas prices, while 44% are motivated by environmental impact.
-
Generation Z and Millennials between 18 and 29 are the most likely to purchase an EV, with 55% indicating interest.
65% of EV owners are under the age of 45.
71% of men expressed interest in EVs, compared to 34% of women.
48% of urban residents are most likely to purchase an EV, followed by 40% in suburbs and 24% in rural areas.
EV owners are predominantly White/Caucasian (62%), followed by Asian (15%).
-
Gasoline-powered vehicle sales peaked in 2017, while gasoline demand peaked in 2019.
Gasoline-powered vehicle demand continues to decline as more consumers transition to electric vehicles.
Global EV sales are projected to increase at least four times between 2023 and 2030, accounting for between 62% and 86% of global vehicle sales by the end of the period.
-
The annual fuel cost of a gasoline-powered vehicle is 357% higher than that of an EV.
EVs are 75% more cost-effective than gasoline-powered vehicles due to lower energy costs.
70% of vehicle buyers are interested in transitioning to EVs to save on fuel costs.
Gasoline-powered vehicles emit 4.6 tons of CO₂ per year, while EVs have zero carbon exhaust.
E. Cost and Maintenance
-
In 2024, the average cost per mile for driving a gasoline-powered vehicle was 71% higher than that of EVs.
EVs are 75% more cost-effective, with annual energy costs ranging between $525 and $700, compared to approximately $2,400 for gasoline-powered vehicles (based on 15,000 miles per year).
The lifetime repair and maintenance cost of a gasoline-powered vehicle is double that of EVs.
The average per-mile maintenance cost for gasoline-powered vehicles is $0.061, while EVs average around $0.031.
-
Common maintenance for gasoline-powered vehicles:
Oil changes (every 5,000–7,000 miles)
Coolant replacement (every 30,000–50,000 miles)
Brake service (more frequent than EVs due to lack of regenerative braking)
Transmission fluid change
Spark plug replacement
Serpentine belt replacement
Fuel filter replacement
Exhaust system inspections
Common maintenance for EVs:
Battery system checks
Charge port maintenance
Software updates
Brake service
EV owners can expect an average savings of $4,600 in repair and maintenance costs over the vehicle's lifetime compared to gasoline-powered vehicles.
-
Modern lithium-ion EV batteries can last between 12 to 15 years or 100,000 to 200,000 miles.
Battery replacement costs range from $5,000 to $16,000, depending on battery size and manufacturer.
As battery production costs are projected to decrease from $115/kWh in 2024 to $32/kWh by 2030, consumers can expect significantly lower battery replacement costs over time.
-
EVs require less frequent repairs due to having fewer moving parts.
EVs typically have 20 moving parts, while gasoline-powered vehicles have over 2,000.
EVs require less frequent brake maintenance than gasoline-powered vehicles due to regenerative braking.
-
EV repairs may take up to 25% longer on average than gasoline-powered vehicles. However, with the global EV repair service market projected to grow at a CAGR of 18.36% between 2025 and 2030—reaching $93 billion—EV service accessibility is expected to expand rapidly.
F. Driver Behavior
-
The average American drives 37 miles daily and 13,476 miles annually.
Cars stay parked 95% of the time in the U.S. and globally.
-
The average daily commute distance is 26.8 miles.
-
On freeways, rain can reduce the average speed by up to 17%, and snow can slow speeds by 5 to 40%.
Approximately 21% of annual vehicle accidents in the U.S. are weather-related.
EVs can reduce risks when driving on wet, slippery, or icy surfaces by 54% due to their lower center of gravity compared to gasoline-powered vehicles.
-
Only 6.9% of Americans take trips longer than 31 miles on a daily basis.
For summer road trips, 75.42% of Americans planned to take a road trip in 2024, with more than 55% intending to travel within 250 miles of their home.
-
55% of road trip plans fall within the median EV range of 283 miles per charge.
Source: Wards, Energy.Gov, Edmunds, Transport Topics, Bloomberg NEF, J.D. Power, The Buzz EV News, Lead Intelligent, Kelley Blue Book, Tata Consultancy Services, Axios, Scoop, Statista, Pew Research Center, EV Adoption, IEA, McKinsey, U.S. Department of Transportation, U.S. Department of Energy, Visual Capitalist, Work Truck Online, Drive Clean California, Southern California Edison, National Conference of State Legislatures, Efficiency Maine EV Rebates, Pennsylvania EV Rebates, Car and Driver, Cox Automotive, Qmerit, Consumer Affairs, Mullen, RMI, Energybot, AAA Gas Prices, EV Lectron, MIT MechE, Consumer Reports, EV Connect, Recurrent Auto, CBT News, Mordor Intelligence, National Association of Home Builders, EV Engineering & Infrastructure, The Vacationer.
EVs vs. ICE
The Future of Efficiency, Reliability, and Cost

Disclaimer: The information provided in this table is for illustrative purposes only. The comparison between electric vehicles (EVs) and internal combustion engine (ICE) vehicles is subject to change as technology evolves and new research becomes available. Specific vehicle performance, costs, and efficiency may vary based on make, model, and geographic factors.
Sources: www.energy.gov, www.epa.gov, www.consumerreports.org, www.nrel.gov, https://advocacy.consumerreports.org, https://afdc.energy.gov/vehicles/electric, https://www.fueleconomy.gov/feg/atv-ev.shtml, https://driveclean.ca.gov, https://afdc.energy.gov, https://www.fueleconomy.gov, https://www.nrdc.org, https://www.forbes.com
EV Charging Info
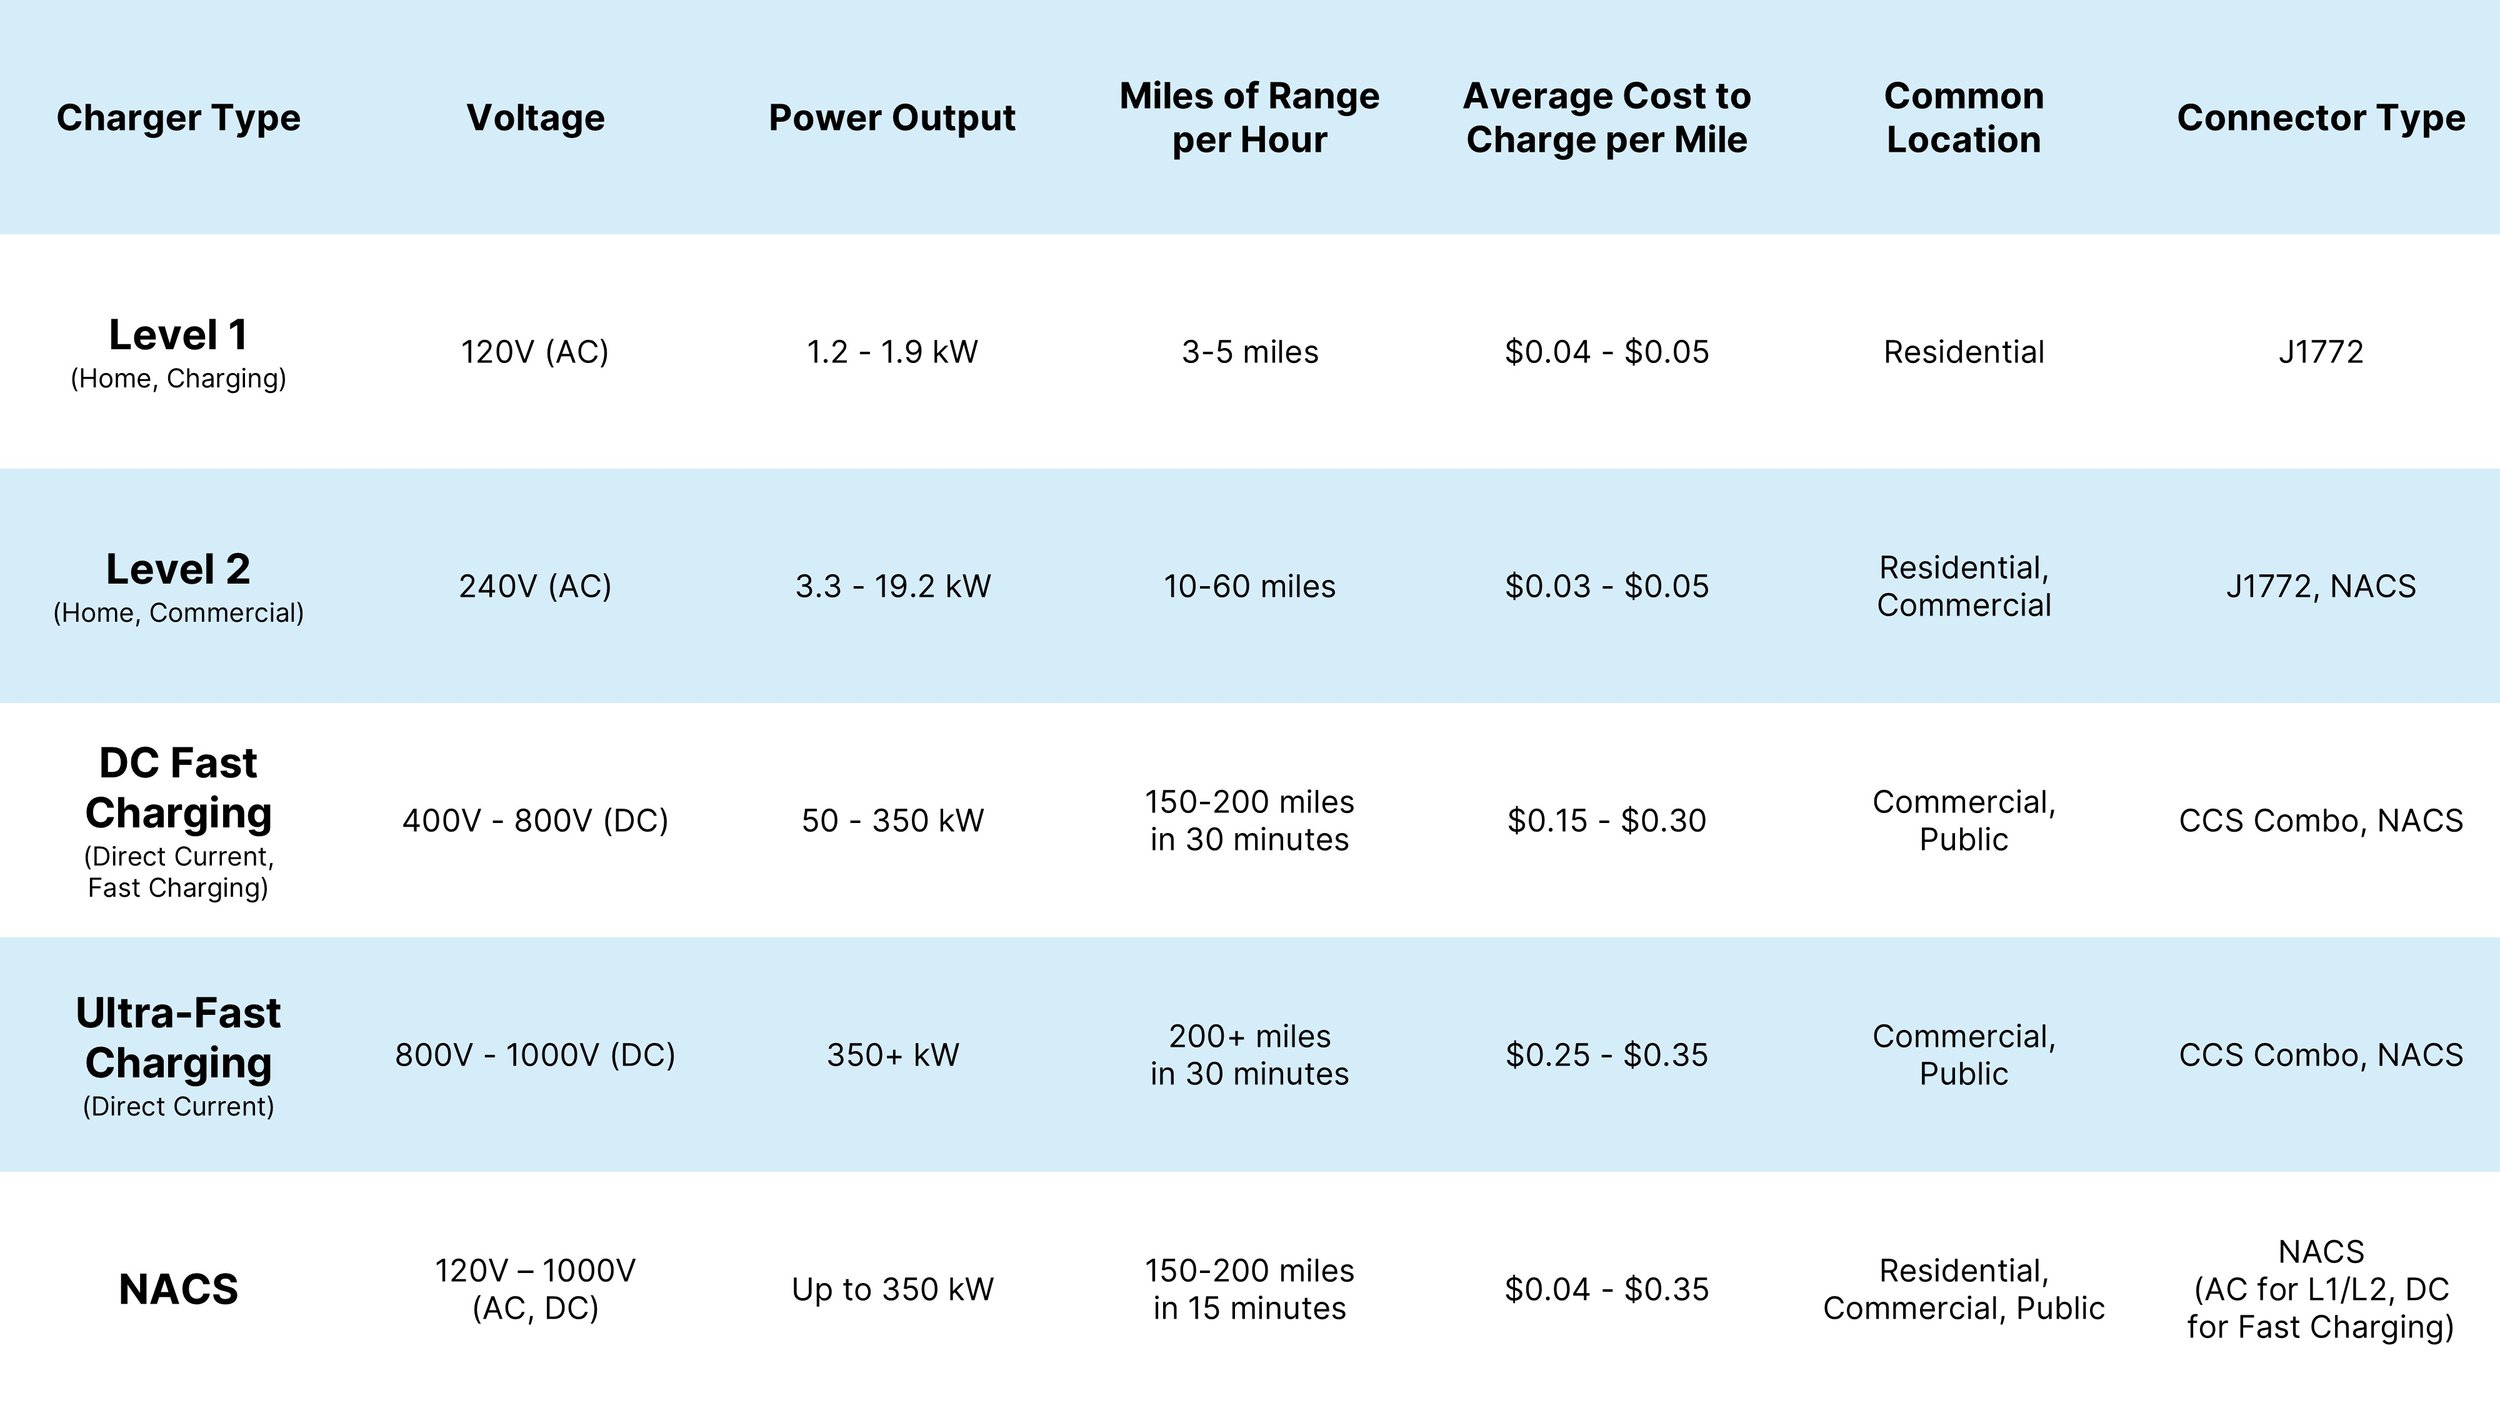

Source: https://afdc.energy.gov, https://www.electrifyamerica.com, https://www.kbb.com, https://www.energysage.com, https://www.tesla.com/charging
Consumer Review Videos


Wolf vs. Others
Value, Variety, Versatility
The Wolf is a versatile EV for daily driving, off-road adventures, and use as a work truck. From basic EVs to serious power, Alpha Motor offers value for everyone. 90.6% rate the Wolf as satisfactory or excellent in terms of performance.*


*As of February 2025, the survey measures consumer satisfaction based on projected vehicle price and specifications.
Survey
We Value Your Feedback
Your input is essential to our improvement.